An end-of-studies internship building a virtual-reality radiation-protection training platform, from Monte-Carlo dose simulation to five volumetric visualization methods and two full training scenarios, presented at EuroXR 2022.
TypeResearch internship
EngineUnreal Engine
HardwareOculus Quest 2
PublishedEuroXR 2022 · Stuttgart
Overview
Radiation protection covers every measure taken to protect people and their environment from the harmful effects of ionising radiation, whether in nuclear facilities, medical imaging and therapy, or radioactive-waste management. Whatever the field, the initial and ongoing training of personnel is fundamental to the safety of workers and the public. The EMERA project (Experimental Platform for Radioactivity Measurements), a collaboration between the Physics & Engineering Faculty of the University of Strasbourg[1] and the IGG (Computer Graphics & Geometry) team of the ICube laboratory[2], set out to build a virtual-reality training tool for radiation protection. During my end-of-studies internship in the IGG team, I was tasked with developing a prototype of this software. I also wrote a short paper on the project that was accepted at the EuroXR 2022[3] international conference, where I presented EMERA in Stuttgart.
Developed during my internship in the IGG team of the ICube laboratory, University of Strasbourg.
Because radiation-protection training matters so much, and because workers are increasingly concerned for their health, a great deal of research and development already exists. Virtual reality is a compelling tool here: it allows training under realistic conditions without any risk, and lets users optimise their practices by seeing the radiation dose they virtually receive. Yet few such tools are on the market, and VR remains uncommon in radiation-protection training.Before writing any code, I studied existing work in the field to identify the major problems faced by projects similar to ours. Two key difficulties stood out:
Simulating radiation everywhere - simulating every radiation/matter interaction across the whole workspace is complex and extremely expensive. The projects I studied work around this either by pre-computing the dose rate or by using a cheaper, less accurate calculation.
Representing the dose rate - there are many techniques to represent volumetric data in space, each with strengths and weaknesses. Combining representational accuracy with genuine user understanding is hard.
These two problems, and the solutions chosen by the projects I reviewed, strongly shaped our project and my implementation choices.
Computing the received dose
It is essential for anyone exposed to ionising radiation to minimise how much they absorb. This is the ALARA[4] principle (As Low As Reasonably Achievable), and radiation protection is the practice of respecting it. The dose received while carrying out the exercises is therefore one of the primary measures of a user’s performance, so I had to build a system to compute it.
Pre-computed dose maps with GATE
Before computing the received dose, you first need the dose rate at any point in space. I chose to pre-compute the radiation field as dose maps produced with the Monte-Carlo simulation code GATE[5]. Each virtual room is discretized into voxels of variable resolution (currently 10×10×10 cm³), and the dose rate of each voxel is computed from the number of primary particles (photons, electrons) within its volume.Setting the parameters before or during an exercise dynamically loads the matching dose-rate map from the database. In the interventional-radiology scene, this database holds maps computed for several radiation energies (50-150 keV), several positions of the machine’s mechanical arm, and certain special cases, such as a leaded screen at leg level, or a doctor standing inside the radiation field.
An inverse-kinematics avatar with sensors
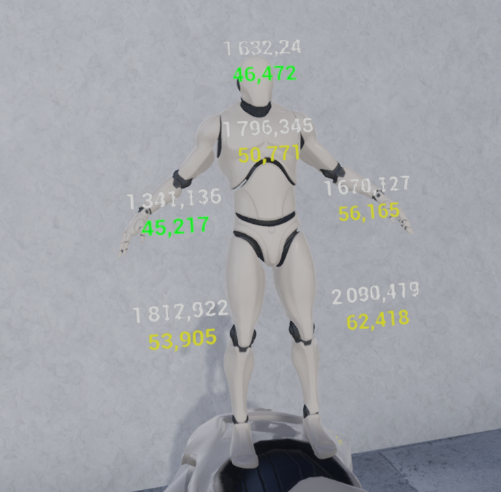
I then built a virtual avatar driven by inverse kinematics to reproduce the user’s movements in the software, and placed sensors at key locations on it. Each sensor follows the body part it is attached to, so moving the right hand only moves the sensor on the right hand. A sensor’s position determines which voxel it sits in, which in turn gives the dose received by that body part.So that users can watch, in real time, both the dose per second and the cumulative dose for each body part, they can summon a 3D miniature of the avatar onto their right wrist.
A 3D miniature on the wrist displays the dose received by each body part in real time.
Visualizing the volumetric data
How the radiation field is visualised, and how the user perceives it, is central to a radiation-protection training tool. I therefore developed five visualization methods (plus variants), which were later evaluated in a user study.
1. Transparent spheres
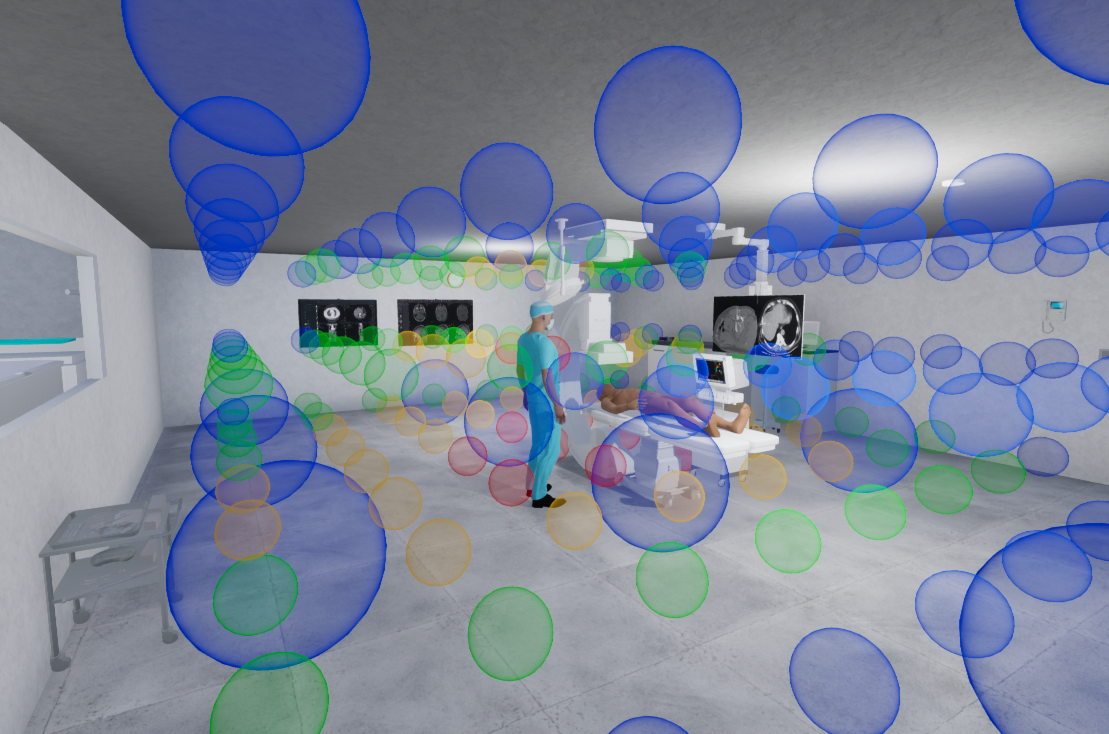
The first method draws a coloured transparent sphere for each portion of the discretized space. The transparency is driven by the empirical Fresnel-coefficient approximation from the NVIDIA Cg tutorial[6]:
R=max(0,min(1,bias+scale⋅(1+I−N)power))Empirical Fresnel approximation used for sphere transparency.
R - the Fresnel coefficient at a given point
I - the vector from the eye to the point on the surface
N - the normal of the point in world space
bias, scale, power - variables controlling the appearance of the Fresnel effect
In graphics, the Fresnel coefficient defines a surface’s reflectivity as a function of view angle and surface normal. Here I repurpose it to set sphere transparency (sharp contours with a near-transparent interior) so each sphere stays distinct while minimally blocking the user’s view.
Transparent spheres: Fresnel-based transparency keeps contours crisp and interiors clear.
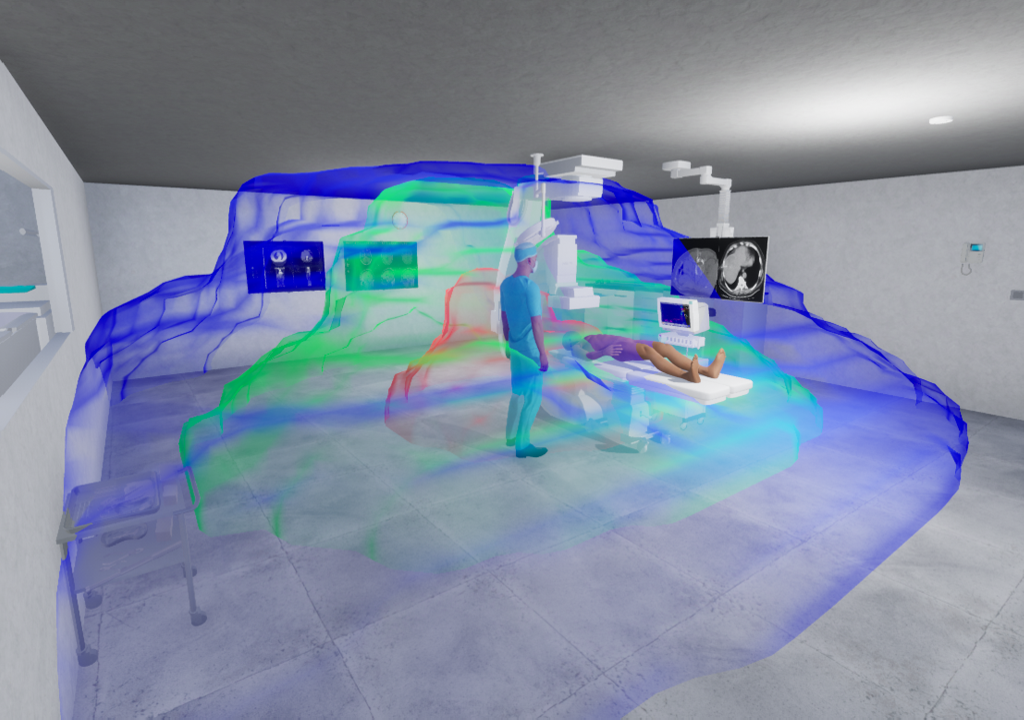
2. Iso-surfaces
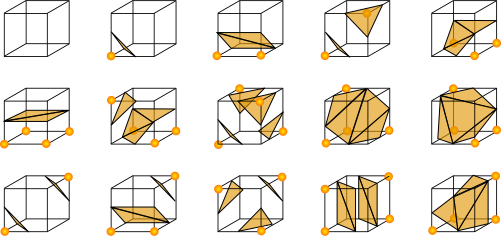
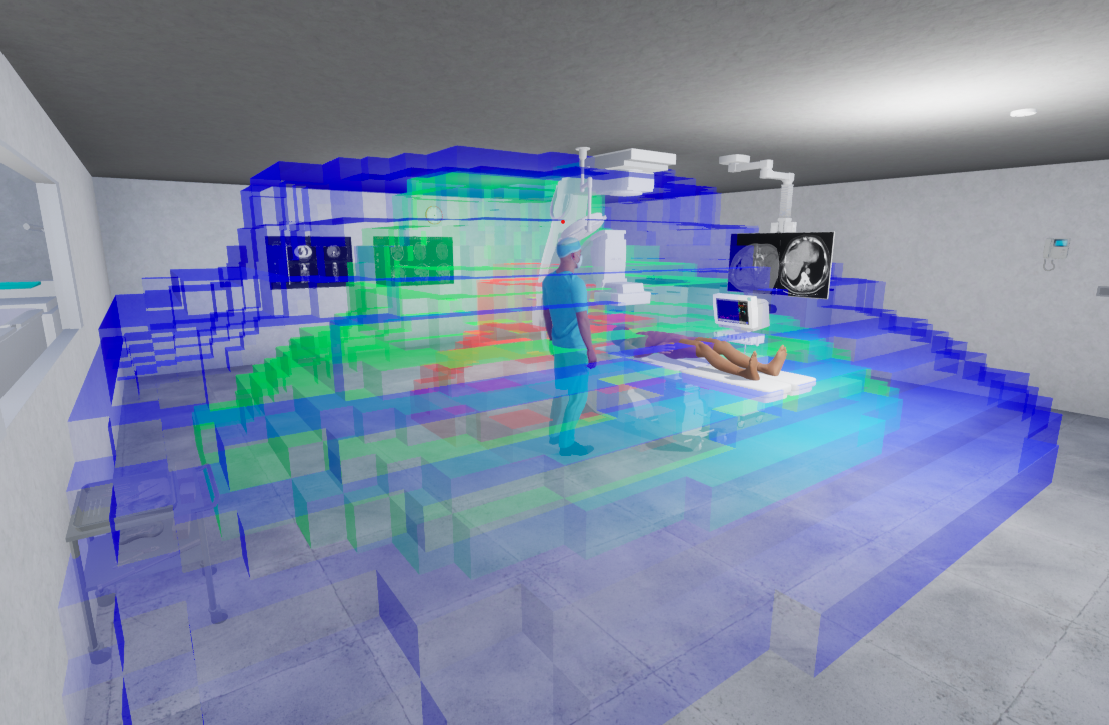
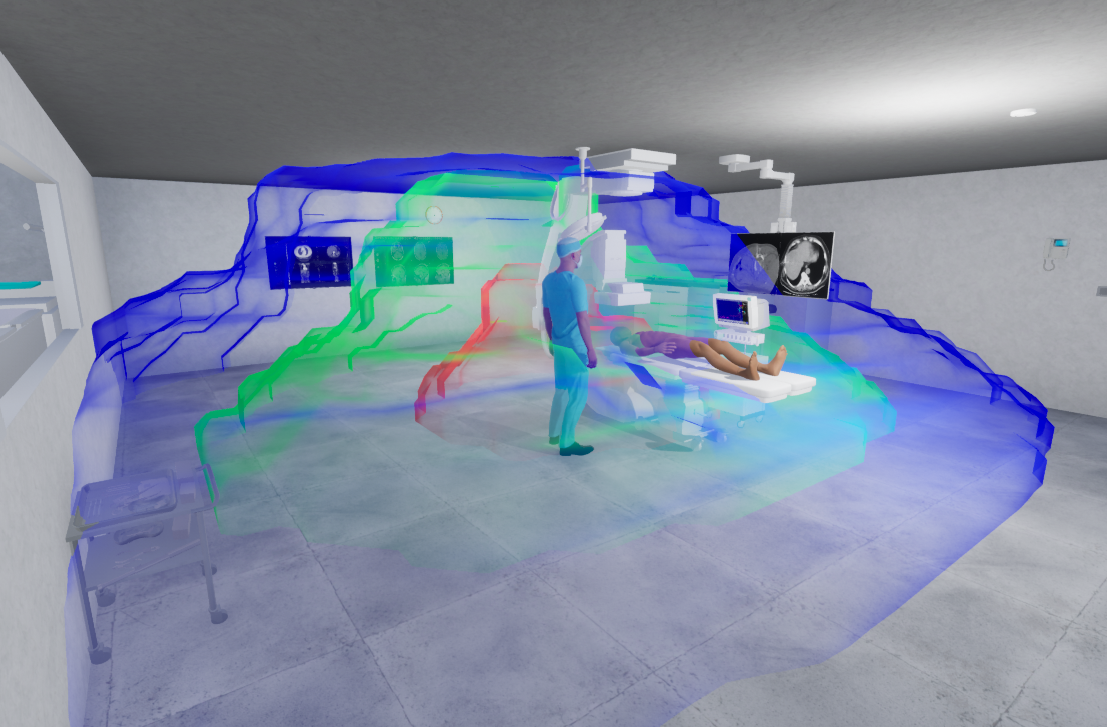
The second method builds three transparent iso-surfaces (meshes of our volume data) at three intensity thresholds. I implemented and tested three algorithms to generate them. The naive one walks the 3D value grid and draws a voxel wherever the value exceeds the threshold. The second uses marching cubes[7] for a smoother mesh: each voxel spans the space between 8 grid points, and the surface inside is selected from a precomputed table of 256 polygon configurations (8 vertices, so 2⁸ = 256), with each mesh vertex placed on a voxel edge by linear interpolation of the two corner values. The third uses surface nets[8], which is very similar to marching cubes but positions vertices freely anywhere inside the voxel volume, computed dynamically rather than from a lookup table. It is more complex to implement, but smoother than marching cubes.
Marching cubes triangulates each voxel using these 15 base cases, plus their rotations and reflections.
Naive voxels
Marching cubes
Surface nets
The three iso-surface algorithms compared: naive voxels, marching cubes, and surface nets.As with the spheres, the Fresnel coefficient drives the iso-surfaces’ transparency. Surface nets was chosen as the default for this method, though all three algorithms remain implemented and usable in the software.
3. 2D average
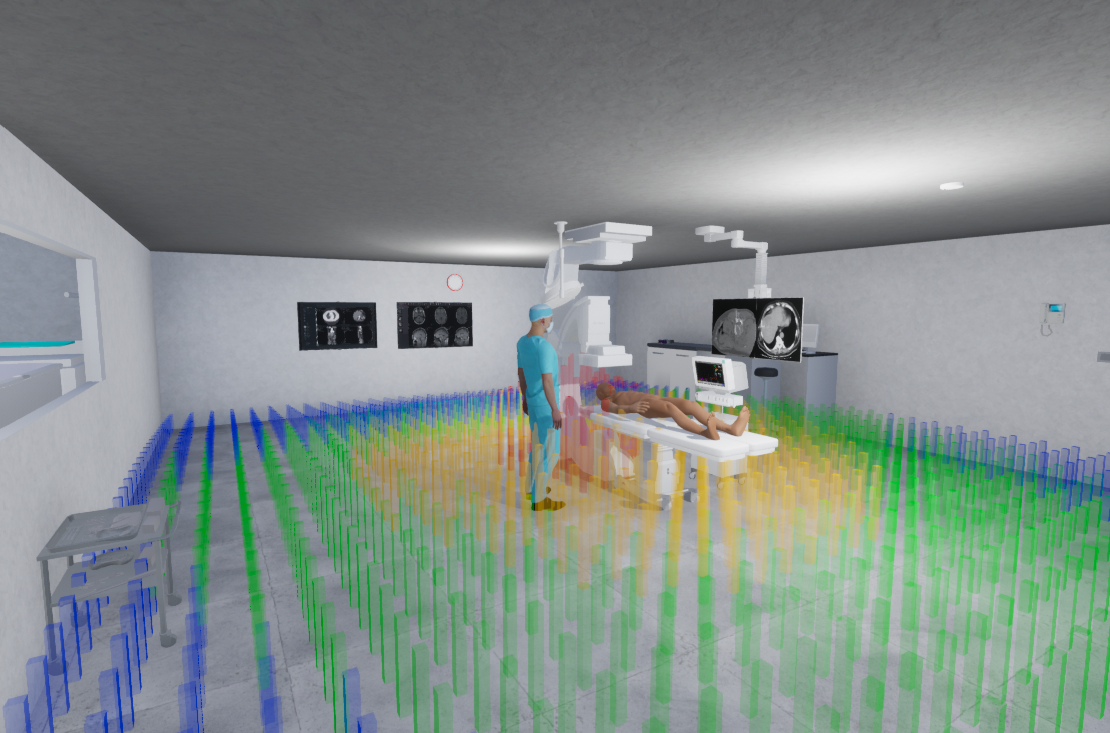
The third method draws a histogram on the floor, where each bar’s height represents the average of the data in its column. It sacrifices the volumetric information of the dose maps to make the visualization easier to read. Since the dose in a voxel follows an inverse-square law, a linear scale fails to convey intensity variations expressively, so I used a logarithmic scale that represents the data more naturally:
dose∝distance21Dose falls off with the inverse square of distance, hence a logarithmic height scale.
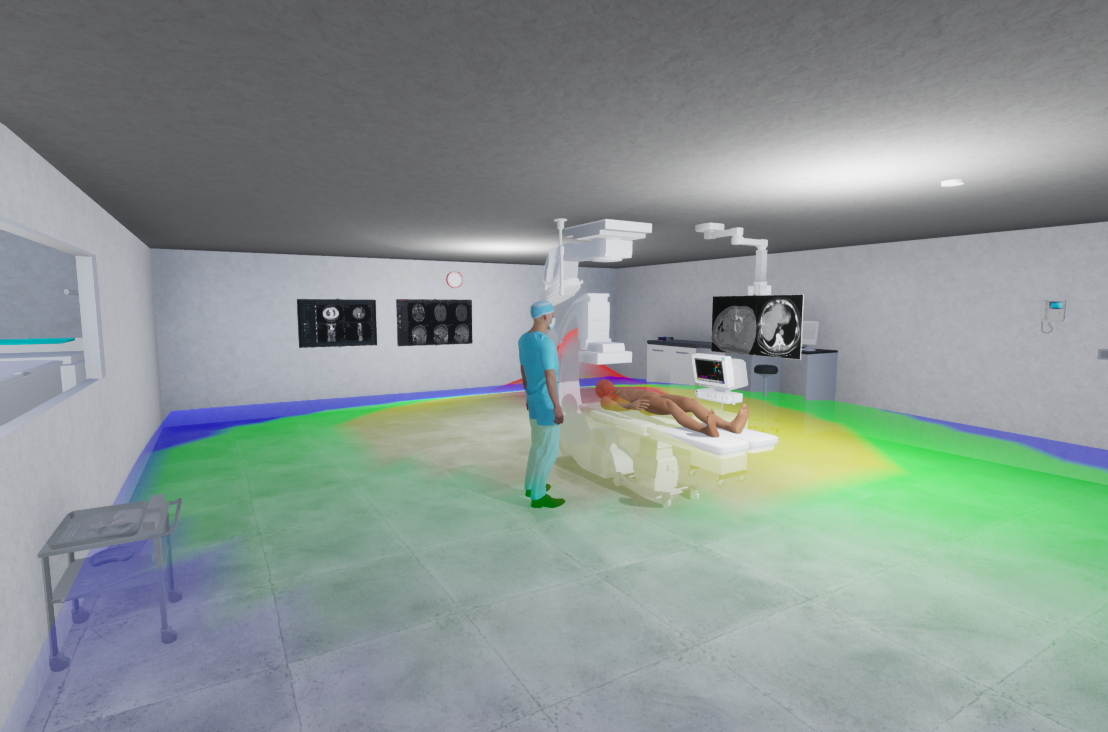
I also built a variant that replaces each bar with a vertex, producing a 2D grid of vertices whose heights are defined the same way, a continuous mesh instead of discrete sticks.
Bar histogram
Continuous mesh
2D average: a floor histogram (left) and its continuous-mesh variant (right).
4. Particles
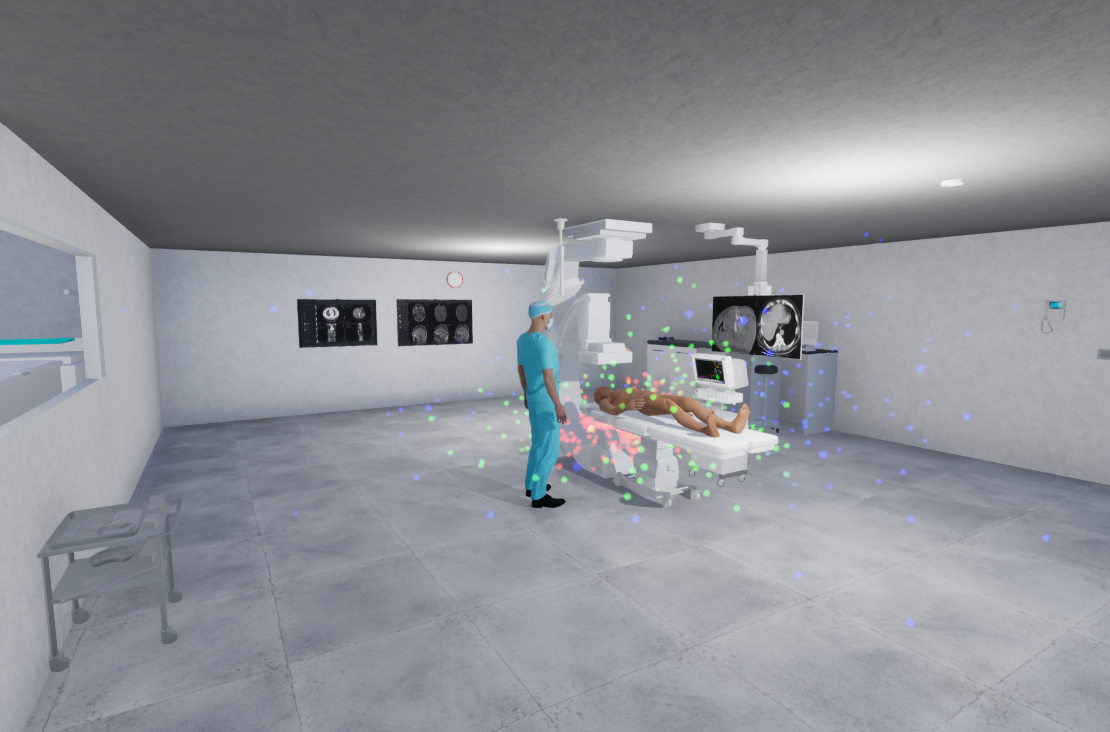
The fourth method displays a large number of particles whose positions follow a random distribution weighted by the dose-map values, so particle density in a region reflects the field intensity there. These are generated with Unreal’s built-in Niagara[9] particle system. I also made a variant with moving particles that start at the source and travel to a position chosen the same way, mimicking a fog chamber. Since the software only knows a discretization of intensities (not real trajectories), the particles move along a segment; the variant is a deliberate simplification meant to show intensities in space rather than true particle paths.
Particles: density is weighted by the dose map, generated with Unreal’s Niagara system.
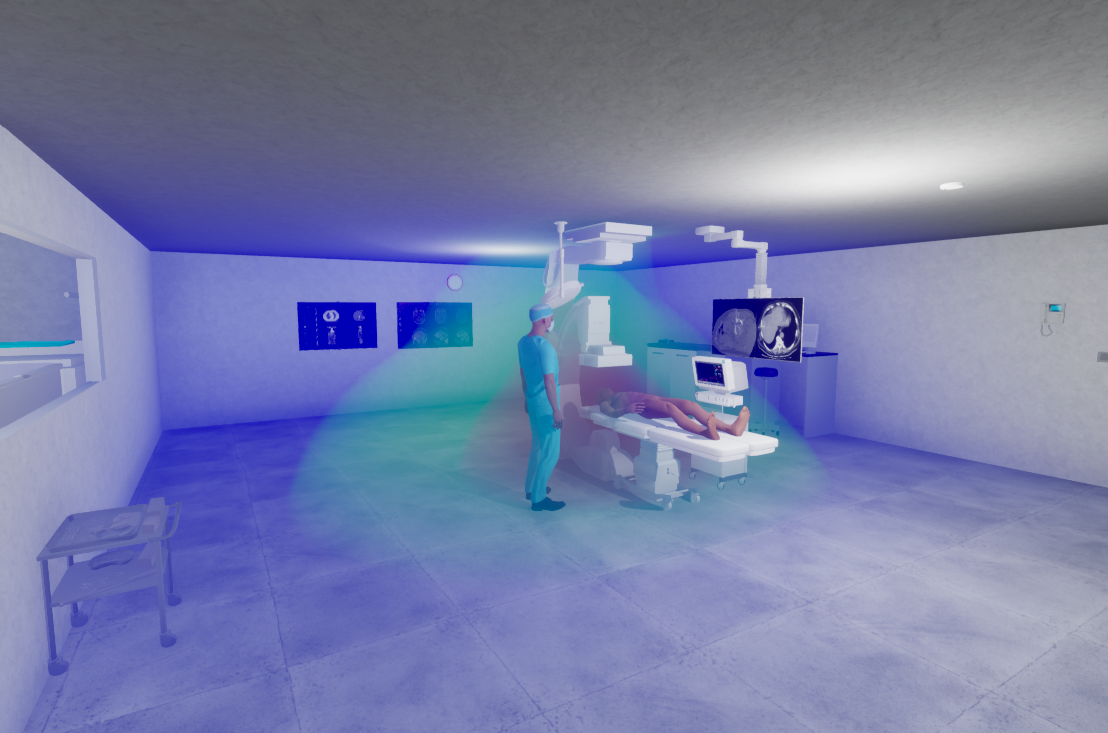
5. Ray marching
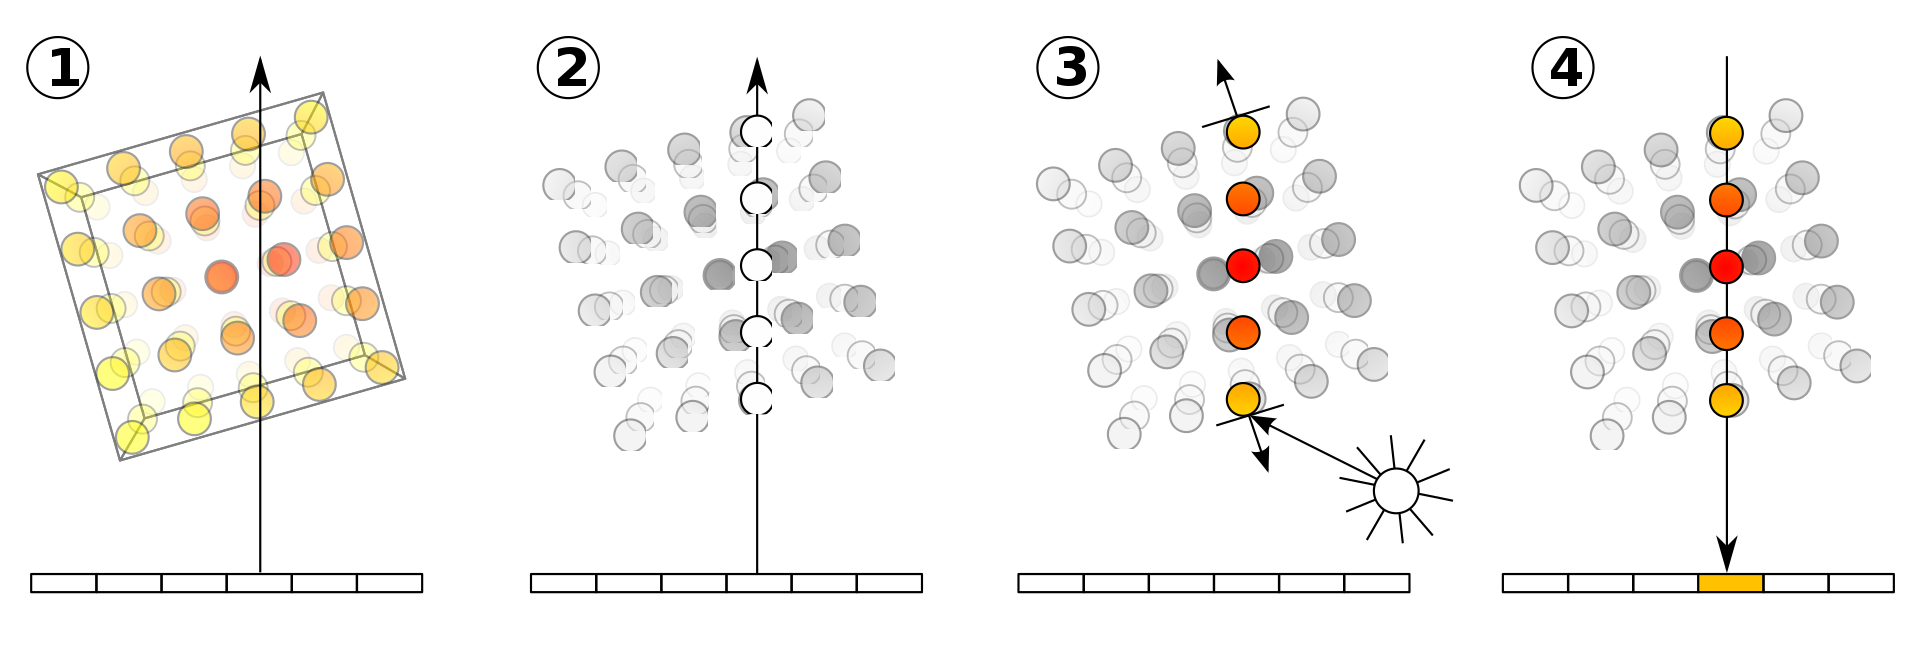
The fifth and final method is direct volume rendering by ray tracing, commonly used to display medical scans and relevant here for its versatility. The algorithm has four steps:
Ray tracing - for each pixel of the final image, cast a ray from the camera through the volume.
Sampling - define sample points along the ray segment inside the volume; each sampled value is an interpolation of the surrounding voxels.
Colouring - a transfer function maps each sample’s value to a colour and opacity (illumination is constant in our implementation).
Composition - the sampled colours are composited (a simple sum here) into the pixel’s final colour.
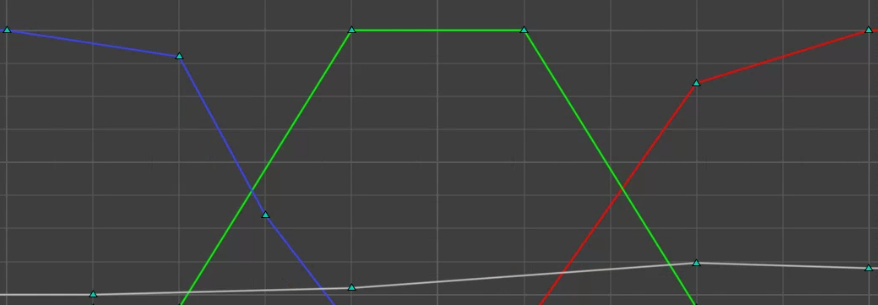
The four steps of ray-marching volume rendering.The transfer function defines the final look: with a single medical dataset, for example, you can show only bones or only blood vessels just by changing it. Defining an optimal transfer function is a complex and important task; in our project it is set manually with a series of keys.
The transfer function used in the project: the red, green and blue curves set colour intensity, and the white curve sets opacity.
Ray marching: a smooth, continuous direct volume rendering of the dose field.
The training scenarios
To cover the range of fields and situations encountered in radiation protection, the software offers two separate exercises in two scenes: one for the medical field (interventional radiology) and one for the industrial field (contamination research). In each, the user carries out several missions in an exposure situation while keeping the received dose to a minimum (ALARA). Protective equipment and measurement systems can be selected to suit the situation, and missions can be played at several difficulty levels based on whether the 3D radiation field is visible or not.
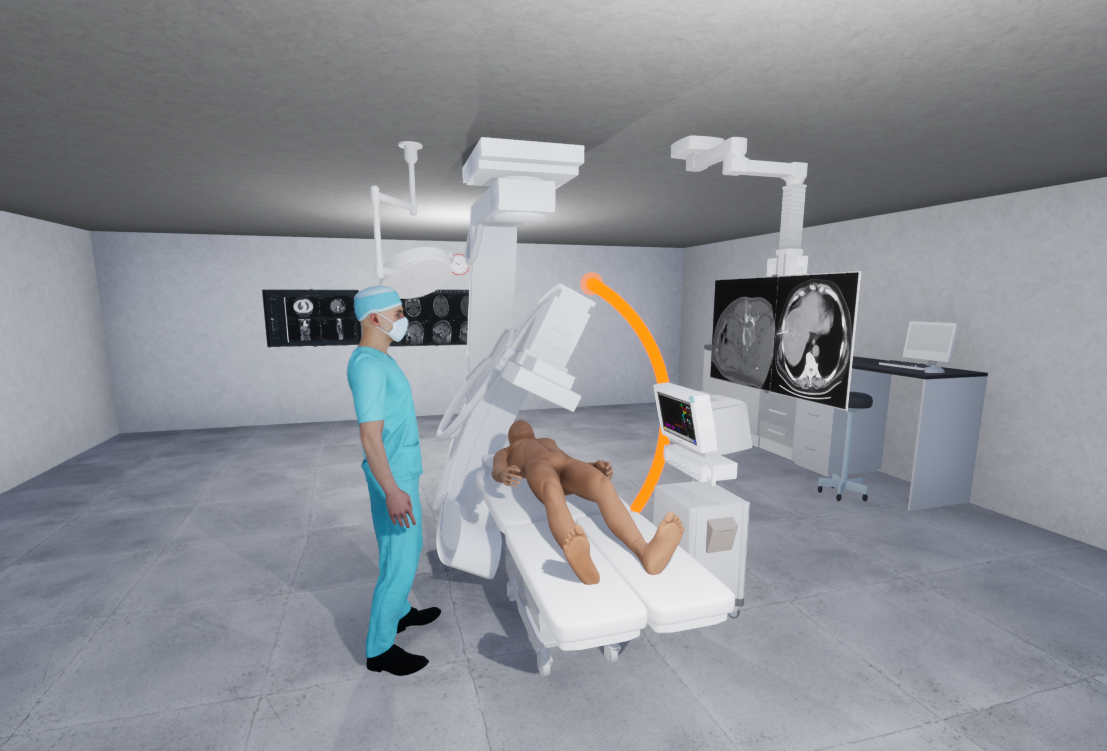
Interventional radiology
The first set of scenarios takes place in an interventional-radiology room, where radiation is emitted by an X-ray generator at the centre of the room that can be repositioned by rotating its mechanical arm. A series of exercises, focused mainly on where personnel stand during the procedure, are offered with different visualization methods. By becoming familiar with the radioactive environment, and with adjustable parameters such as beam energy and intensity, the user learns to optimise their positioning and movement to reduce total dose. At the end of an exercise the tool reports the dose received by each body part (head, trunk, arms, legs) and how those doses evolved over time.
Interventional radiology: a rotating mechanical arm repositions the X-ray source.
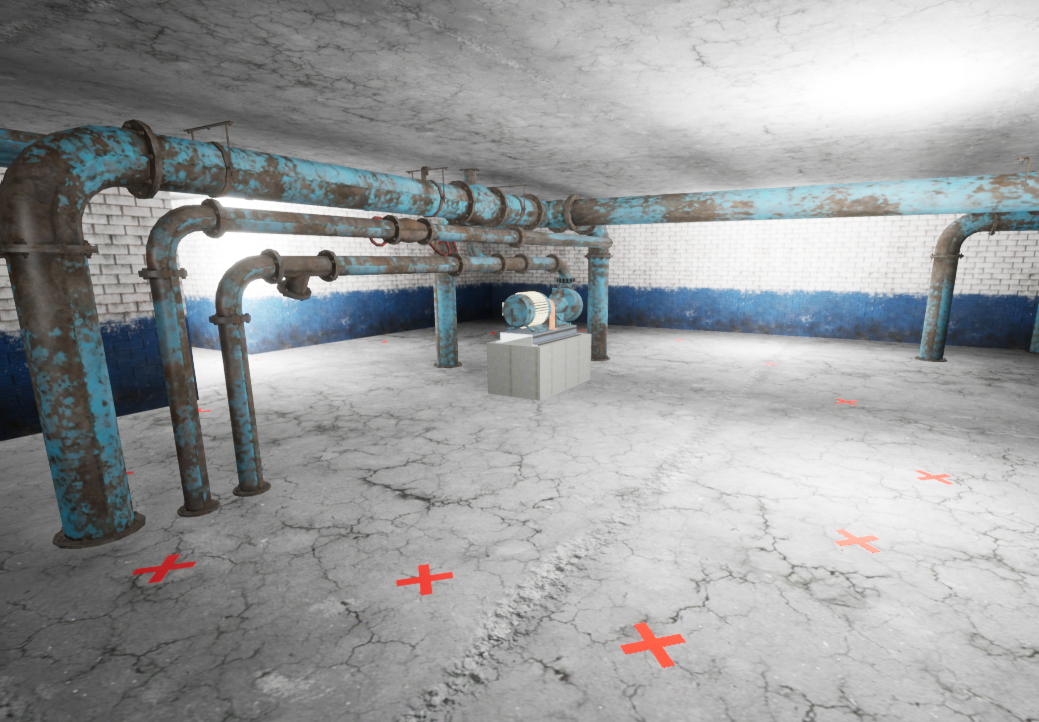
Contamination research
The second set of scenarios takes place in an industrial environment, where radiation comes from one or more contamination sources hidden in the room (point sources, liquid contamination residues, and so on). Using a dose-rate measurement system (several detector types are offered, more or less suitable depending on the contamination) and a spray-paint can, the user must delimit a safety perimeter around each contamination zone they identify. Once the perimeters are drawn, the radiation field is revealed and the user is scored on both the dose received per body part and the accuracy of the delimited area. The exercise trains and evaluates contamination-research procedures: choosing the measurement system, delimiting zones, managing risk-taking, and more.
Contamination research: delimiting a safety perimeter with a detector and a spray can.
User study
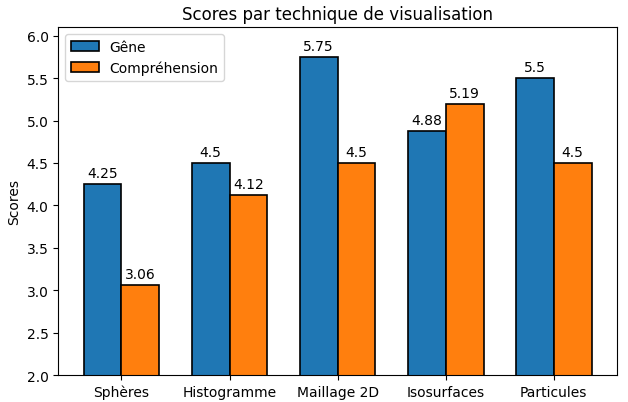
To evaluate the visualization methods, several participants tested the interventional-radiology scenario and then answered a 6-point Likert[10] questionnaire rating the discomfort each visualization caused and the clarity of the radiation-field representation. Selected results (out of 6):
Histogram variant - highest comfort (5.75): it sacrifices 3D information for a lower visual load, and its continuous mesh avoids the overlap of separate sticks.
Iso-surfaces - highest field clarity (5.19): three continuous meshes with little overlap and good fidelity to the data.
Transparent spheres - lowest on both criteria (4.25 comfort, 3.06 clarity): the many overlapping objects overload the view.
Participant feedback: comfort and field-clarity ratings across the visualization methods.These questionnaires were run while the software was still in development, so ray-marching visualization was not included in the tests. Overall, participants reacted positively to the exercise and found the software relevant for educational use.



 Naive voxels
 Marching cubes
 Surface nets
 Bar histogram
 Continuous mesh